How to Read Audiomack Creator Dashboard Analytics: Heatmaps, Re-Up Maps & Routing Your Next Run
Raw stream numbers are mostly vanity. Having 100,000 plays on a tape looks solid on an Instagram carousel, but if you don’t know who is listening, where they live, or whether they’re skipping after the intro, those plays won’t sell out a venue, move physical merch, or build a career that lasts.
Audiomack has stayed the main incubator for street rap, drill, and Afrobeats because it gives artists raw, unfiltered data. Knowing how to read Audiomack creator dashboard analytics is how you stop guessing and start running your independent operation like a real business—turning cold backend metrics into booked dates, high-converting promo runs, and actual regional leverage.
Here is how to unpack your geographic listener heatmaps, read re-up (replay) metrics, and calculate true completion rates to turn localized noise into national streaming momentum.
1. Decoding the Plays by Geo Map: Locating Your Real Footprint
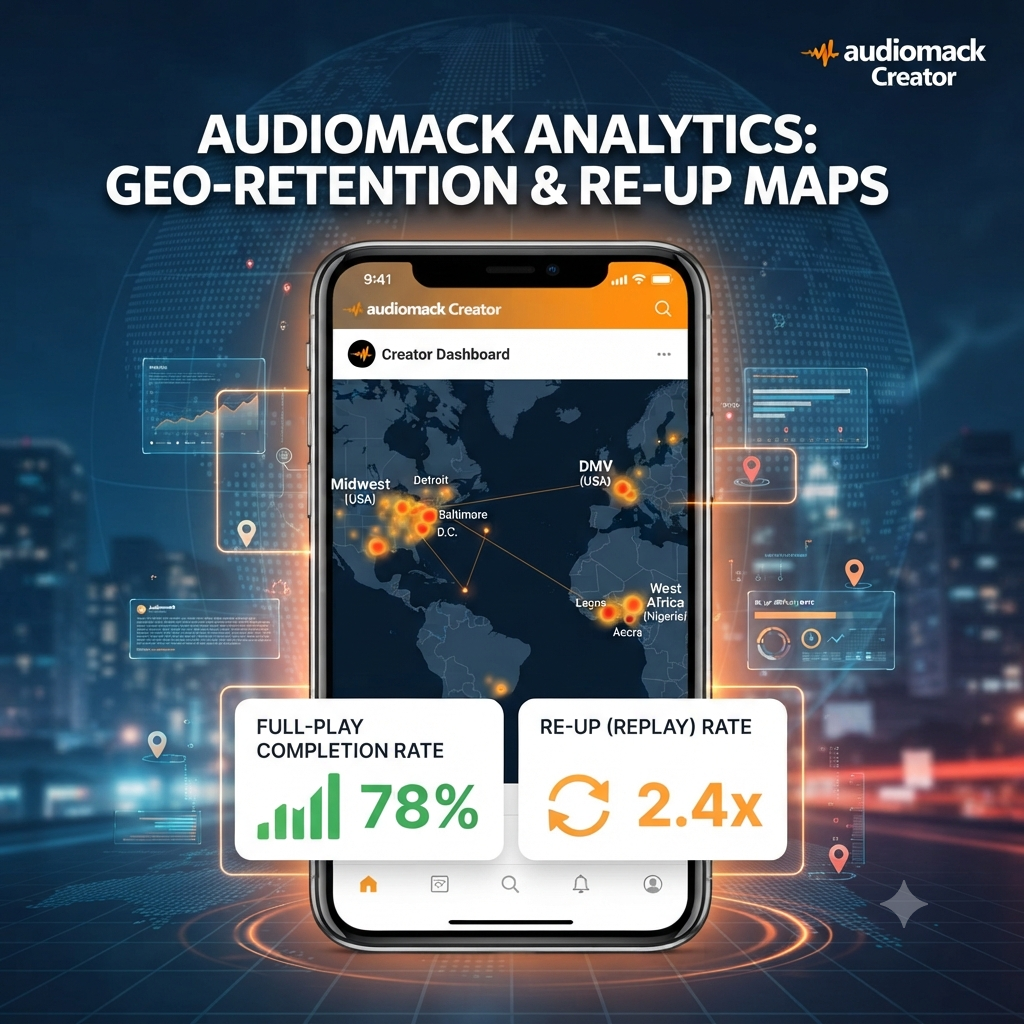
When you open your Audiomack Creator Dashboard—whether on desktop or through the mobile Creator App—the Plays by Geo map breaks down your streaming activity all the way down to specific cities.
For independent street rappers, macro country-level stats don’t tell the full story. A thousand plays spread across the entire United States doesn’t help you build a movement; a thousand plays stacked inside four specific neighborhoods in Detroit or Baltimore gives you a launchpad. You need to locate hyper-local pockets that align with your specific subgenre, lifestyle, and sound.
The Midwest Circuit (Chicago, Detroit, Milwaukee, Cleveland)
Midwest rap audiences move on deep regional loyalty and heavy trunk-rattling bounce.
-
What the map is telling you: Watch for concentrated spikes in tier-two and tier-three cities, not just Chicago. If places like Milwaukee, Flint, or Cleveland pop up in your top city breakdown, your records are circulating in real car systems and private playlists.
-
The Play: Don’t just sit on those numbers. Use those city spikes to pitch regional club DJs, partner with local mixtape hosts, and reach out to independent venue promoters in those specific ZIP codes.
The DMV Corridor (D.C., Maryland, Northern Virginia)
The DMV operates as a dense, fast-moving ecosystem fueled by Go-Go rhythms, heavy sub-bass, and aggressive street flows.
-
What the map is telling you: Look for tight, interlocked clusters spanning Baltimore, Prince George’s County, and D.C. proper.
-
The Play: High density in the DMV means your record has strong viral potential on social platforms. When you see a heat flare here, it justifies running micro-targeted local ads and pulling up for unannounced listening sessions or pop-up events.
West Africa (Lagos, Accra, Abuja)
Audiomack is a dominant streaming powerhouse across West Africa, making it a critical hub for global discovery.
-
What the map is telling you: A surge in Lagos or Accra isn’t an anomaly—it means your cadence, hooks, or energy are crossing over into international DJ sets and Afro-drill circles.
-
The Play: Tap in directly instead of ignoring overseas plays. Connect with West African content creators, look into local DJ edits, and push targeted digital promo to keep that international momentum building.
2. Re-Up Maps & Completion Rates: Separating Passive Plays from Real Fans
A high play count can fool you if half those listeners skip your song 15 seconds in. To measure actual fan conversion, you have to cross-reference geographic data with retention stats like Full-Play Completion Rate and Re-Up (Repeat Play) Rates.
[Total Plays] ──> Filter by [30-Sec Plays vs. Full Completion] ──> Cross-Reference with [Re-Ups Per City]
Track Completion Rate vs. 30-Second Skips
In your individual track breakdown, line up total starts against your 30-second retention rate and full song completion rate.
-
Low Completion Rate (Under 35%): People are checking out early. Your intro might be dragging, the beat drop might take too long, or the mix isn’t pulling them in fast enough.
-
High Completion Rate (Over 65%): Listeners are riding the track out to the final second. This is your core single, regardless of whether another track currently has a higher total stream count due to playlist placement.
Tracking the “Re-Up” (Repeat Activity)
Repeat plays (Plays Per Listener) prove a song has genuine replay value. Anyone can get a passive click, but repeat plays mean your music is stuck in someone’s head.
-
When a specific market shows both a high completion rate and a high re-up rate, you’ve struck gold: that’s a verified pocket of die-hard fans.
-
These specific cities are where you focus your physical energy—booking pull-up shows, setting up merch drops, or mobilizing local street teams.
3. Routing a Regional Run Using Backend Data
Stop booking show dates based on where you want to perform and start booking where your data says you already have an audience. Here is a step-by-step framework to map out a profitable run using your dashboard:
-
Filter by 90-Day City Data: Ignore lifetime stats for routing. Look strictly at where your momentum has built over the last three months.
-
Select 3 to 4 Anchor Cities: Find a cluster of cities located within a reasonable driving distance (200 to 400 miles apart) that all display strong repeat listener numbers.
-
Right-Size Your Venues: Match your active city listener numbers to room capacity. If you have 400 active monthly listeners in a market, aim for a 150 to 250 capacity room to guarantee a packed, high-energy environment.
-
Run Hyper-Local Geo-Ads: Put promo budget behind targeted social clips running exclusively in those specific city ZIP codes starting two weeks before show night.
Once you know how to read your backend stats, you can easily turn your regional data insights into national streaming momentum using our hip-hop playlist networks.
Quick Reference: Decoding Your Dashboard Metrics
| Dashboard Metric | What It Actually Means | How to Use It |
| Plays by Geo (City Level) | Exact locations where your tracks get pushed play. | Planning tour stops, setting ad radiuses, and hitting local DJs. |
| Full Completion Rate | Percentage of users listening to the full song. | Testing song arrangements, intro lengths, and mix quality. |
| Plays Per Listener (Re-Up) | Average number of times an individual replays a track. | Identifying your true standout singles and replay value. |
| Playlist Play Sources | Where your streams originated (user, editorial, algorithmic). | Balancing passive playlist algorithm plays with active organic searches. |
Taking the Next Step with Your Data
Data gives you direction, but execution is what turns backend numbers into a sustainable career. When you spot a city heating up on your map, double down on that region. Push content that speaks directly to that audience, tap in with local tastemakers, and keep feeding the momentum until those streaming numbers translate into real-world leverage.